Graylog with Spring Boot
May 04, 2016
This was originally posted at Object Partners
One of the most difficult things to do in any application is find a way to make use of the mountains of logs that are generated, especially in a Production environment. Over the years a number of tools have emerged to tackle this problem. Designed as massive data stores and analysis engines, tools like Splunk allow you to collate and process logs from a vast array of sources and manipulate the data they contain into usable alerts, dashboards, and automated actions.
I’m a huge fan of Splunk and have seen it used to great effect in large-scale deployments. It’s user friendly and extremely powerful, but has a huge downside: price. This makes it unattractive for small projects and impractical for personal/hobby development. But all is not lost – Graylog is an open-source, free-to-use alternative that has has many of the top features supplied by Splunk. In this article I’ll talk about how I familiarized myself with the basics of Graylog’s recently released version 2 and show off an example SpringBoot app that uses it.
What is it?
The simplest way to describe Graylog is as an event archive and analysis toolkit. The basic idea is that you publish events that happen inside your application and Graylog stores them into a MongoDB instance. Later, these events can be searched via an ElasticSearch cluster and then combined to generate trends, charts, tables, and other views of that data.
How does data get to it?
A lot of different mechanisms exist. In the example application I show off HTTP and UDP endpoints that accept GELF (Graylog Extended Log Format) data, but you can also configure ways to send plaintext or even hook up your OS’s syslog. The real magic comes in how you can interface those endpoints into your application. One of the most powerful is to hook into your existing logging solution which gives it access to all significant events that you’re already capturing (most notably errors) and then dispatch them in the background to Graylog; this approach allows you to transparently add Graylog to your application without tightly coupling your code to it.
How do I use it once data is there?
At it’s core Graylog is a facade over an ElasticSearch cluster backed by MongoDB. Dynamic queries can be written to find any permutation of event data. From a user interface perspective, most of the focus is on Dashboards. A Dashboard is a collection of widgets, each of which is a chart/table/trend backed by a query. By crafting queries and widgets you can keep track of ongoing events in your application, keep an eye on performance and system load, monitor suspicious events, or track down details on an error one of your users encountered.
You mentioned an example app?
Out on GitHub there is a SpringBoot application that fires up a (as much as possible) self-contained Graylog instance, configures it, and publishes events to it. I say ‘as much as possible’ for the following reasons:
- There is no pure-Java MongoDB: I’ve configured an embedded Mongo provider to download binaries at runtime in a way that doesn’t pollute your computer.
- Graylog is intended to run as a standalone process – it ships with a control script to launch it within its own JVM instance. I’ve created the necessary Spring configs and beans to get it to launch within the SpringBoot JVM but this comes with its own limitations (namely memory and classpath separation) which may make this configuration impractical for other setups.
When the application starts it launches an ElasticSearch node, downloads and launches MongoDB, and initializes the Graylog instance. Once those are all up and running it makes a number of ReST calls to the Graylog service interface to establish a basic configuration and a customized dashboard.
Maven
Normally I prefer to use Gradle but in this case I needed to use the perfectly-capable Maven to handle dependencies. Some of Graylog’s dependencies have malformed POM files which Gradle does not handle as gracefully as Maven.
The Maven build, other than handling the download of dependencies, also takes care of some minor setup by extracting a ZIP archive containing some native libraries needed by Graylog – more on these a bit later.
Spring Boot
The only major tweak I had to make related to SpringBoot was to use a Milestone version of the as-yet-unreleased version 1.4.0. This was primarily to get the benefit of it upgrading to a newer version of ElasticSearch that is compatible with Graylog. Other than that all of the Spring code should be pretty familiar to most Java developers.
One item that may be of interest is that I’ve set up a Swagger Rest API for my application (in addition to the one Graylog supplies) that allows you to view and exercise the very simple Rest service the app provides. It uses a library called SpringFox which I highly recommend taking a look at if you develop Rest services in Spring.
MongoDB
I’ve chosen to use an excellent embedded MongoDB library and configure it using a Singleton Spring bean. Most of this configuration isn’t strictly necessary but helps in keeping all the files that get downloaded in a single place so they get deleted once you’re done with the example.
    // Download Mongo artifacts into the project directory to ease cleanup
    IDownloadConfig downloadConfig = new DownloadConfigBuilder()
            .defaultsForCommand(Command.MongoD)
            .artifactStorePath(ARTIFACT_STORE_PATH)
            .build();

    // Extract Mongo artifacts into the project directory to ease cleanup
    IRuntimeConfig runtimeConfig = new RuntimeConfigBuilder()
            .defaults(Command.MongoD)
            .artifactStore(new ExtractedArtifactStoreBuilder()
                    .defaults(Command.MongoD)
                    .download(downloadConfig)
                    .extractDir(EXTRACTED_STORE_PATH)
            )
            .build();

    // Store Mongo data into the project directory to ease cleanup
    Storage replication = new Storage("./data/mongodb/data", null, 0);

    MongodStarter starter = MongodStarter.getInstance(runtimeConfig);

    IMongodConfig mongodConfig = new MongodConfigBuilder()
            .version(Version.Main.PRODUCTION)
            .cmdOptions(new MongoCmdOptionsBuilder()
                    .useNoJournal(false)
                    .useSmallFiles(true)
                    .build())
            .net(new Net(MongoProperties.DEFAULT_PORT, Network.localhostIsIPv6()))
            .replication(replication)
            .build();

    mongo = starter.prepare(mongodConfig);
    process = mongo.start();
This starts up a Mongo instance that can be interacted with as if it were a standalone instance. When the SpringBoot app stops it stops as well.
ElasticSearch
Nothing is needed to get ElasticSearch up and running other than including the spring-boot-starter-data-elasticsearch dependency in the project’s build file. SpringBoot auto-detects its presence on the classpath and starts up the ElasticSearch node. A bit of configuration is necessary in the application config file to get the appropriate type of node set up so that Graylog can work with it:
spring:
  data:
    elasticsearch:
      clusterName: "graylog"
      properties:
        node:
          local: false
          data: true
        http:
          enabled: true
Graylog
This is the trickiest part – Graylog is a Java application but its API isn’t really designed to be started as part of another program. The first trick is to extract as much as possible from Graylog’s normal boot path and embed it in a Singleton bean, and the easiest way to make this work is to piggyback on Graylog’s built-in launcher that expects to be triggered from the command line.
    // Use the CommandLine launch parser which takes care of triggering all the sub-modules
    // Graylog needs to launch.
    final Cli.CliBuilder builder = Cli.builder("graylog")
            .withDefaultCommand(Help.class)
            .withCommands(Help.class, ShowVersion.class);
    ServiceLoader commandsProviders = ServiceLoader.load(CliCommandsProvider.class);
    // Load all Graylog command handlers so we can process the CLI command
    for (Object commandsProvider : commandsProviders) {
        CliCommandsProvider command = (CliCommandsProvider) commandsProvider;
        command.addTopLevelCommandsOrGroups(builder);
    }

    final Cli cli = builder.build();
    // Run the actual CLI command through the parser
    final Runnable command = cli.parse("server", "-f", graylogConfigFile);
    // Build the command (which is a Runnable) and start into another Thread - necessary
    // since the runnable blocks on the Graylog server process
    final Thread graylogThread = new Thread(command);
    graylogThread.start();
Next, I had to configure the SIGAR library – this is a set of native libraries that Graylog accesses via JNI so it has to be put onto the special Java library path. In case you aren’t familiar with JNI this library path is very different than the standard Java classpath. For more information on JNI take a look at my post on the subject.
System.setProperty("java.library.path", "./sigar-libs");The last thing I had to do was the only really tricky part. Fortunately, Graylog supplies a live Swagger specification for its ReST API, but unfortunately it’s configured to use the System classloader rather than the Thread Context classloader. This causes issues when run within a container like SpringBoot. To work around this problem I had to use some very inadvisable Reflection to swap out the System classloader with a custom one that would delegate to the Thread Context when a Swagger resource was being loaded. I’ll be submitting a PR to Graylog to hopefully resolve this issue in the near future.
    try {
        Field sclField = ReflectionUtils.findField(ClassLoader.class, "scl");
        ReflectionUtils.makeAccessible(sclField);
        ReflectionUtils.setField(sclField, null, new DecoratingClassLoader() {
            @Override
            public URL getResource(String name) {
                if (name.startsWith("swagger/")) {
                    return Thread.currentThread().getContextClassLoader().getResource(name);
                }
                return super.getResource(name);
            }
        });
    } catch(Exception e) {
        LOGGER.error("Failed to replace SystemClassLoader, this means Graylog's Swagger won't work.", e);
    }
Graylog works just fine without doing this, but for this example I wanted to make sure the documentation was functional.
Publishing data to Graylog
Now that we have Graylog configured we need to start pushing data to it. I set up two different paths: a UDP interface that publishes anything sent to a specific Logback logger, and a ReST endpoint. To use these I set up one Aspect that captures calls to a specific service and another that captures errors thrown by that service.
    @Inject
    protected ObjectMapper mapper;

    @Inject
    protected GraylogRestInterface graylog;

    @Around("execution(* com.objectpartners.plummer.graylog.service.QuoteService.*(..))")
    public QuoteResource errorThrown(ProceedingJoinPoint joinPoint) throws Throwable {
        Stopwatch timer = Stopwatch.createStarted();

        QuoteResource quote = (QuoteResource) joinPoint.proceed();

        // Log message via Graylog UDP Logback Appender
        LOGGER.info("Generated quote - {}@{}", quote.getSymbol(), quote.getPrice());

        // Log message via Graylog HTTP Input
        GelfMessage message = new GelfMessage();
        message.setShortMessage(String.format("Quote %s@%2.2f", quote.getSymbol(), quote.getPrice()));
        message.setFullMessage(mapper.writeValueAsString(quote));
        message.getAdditionalProperties().put("elapsed_time", timer.stop().elapsed(TimeUnit.MICROSECONDS));
        graylog.logEvent(message);

        return quote;
    }
Graylog in Action
So, after all this heavy lifting what is the end result?
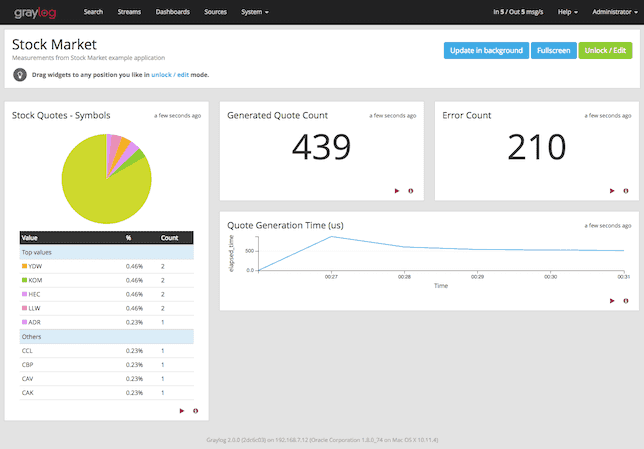
The image above is of the customized dashboard the example sets up. This is a fairly simple example but you can see four different widgets each showing off a different method of tracking and displaying data to the user.
- Quote count: Counts the total number of Quote objects the SpringBoot app has generated
- Symbol Breakdown: Tracks the unique stock symbols that have been requested, broken down by most common
- Generation time: Tracks the average time it took to generate quotes over time
- Errors: All exceptions that are logged get displayed here for easy perusal
- Dashboards are built from ElasticSearch queries that can be easily constructed using the Graylog web GUI.
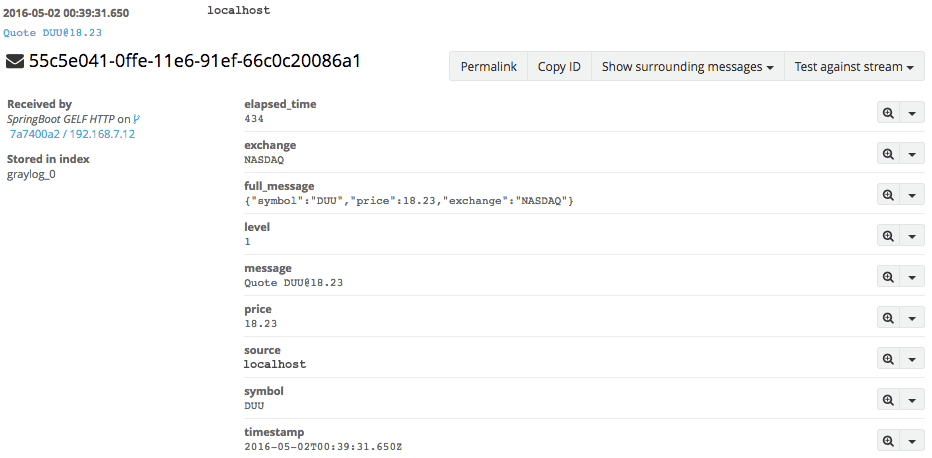
Every message that is sent to Graylog is stored into MongoDB and can be inspected and queried which aids debugging and troubleshooting in the future. Assuming you send the appropriate data into Graylog this means you may never have to dig through application logs again. Below you can see an example of an archived event in Graylog which was automatically parsed from JSON and put into an easy-to-read and easy-to-search format.
What would it take to use Graylog in my project?
For the purposes of the example I’m doing a lot that you shouldn’t do in a production application. If all you need is a prototyping setup or a ready-to-go development configuration the example can be used to get up and running quickly. Beyond that, Graylog has a ready-to-go Docker image that you can easily combine with the Mongo and ElasticSearch images for a more stable and realistic Graylog setup if that is desired. In a true production environment it would be advisable to use a standalone MongoDB instance for better performance as well as a true ElasticSearch cluster to aid distributed processing and storage.
Wrap Up
If Graylog sounds interesting to you I highly recommend taking a look. They’ve got excellent documentation and adding it to your application will definitely make your life easier in the future. If you have any questions about the example application or the article please leave them below. Otherwise, happy coding!