Client-side geospatial analysis with TurfJS
July 30, 2015
This was originally posted at Object Partners
Maps, especially maps of historical data, are one of my favorite ways of consuming information which is why I was excited to finally have a good excuse to create one myself recently. Earlier this year I moved from Colorado to Nebraska and since then many people have been asking me why I would choose to do that. Beyond the typical arguments of winter sports and scenery a common question revolved around severe weather. Wasn’t I worried about tornadoes? Being from the Midwest originally I grew up with tornadoes as a fact of life and immediately dismissed their concerns. Tornadoes, I thought, are far too rare to worry about, but how to prove it to everyone? I decided to fall back on hard numbers and some data visualization to prove my point and elected to create a custom geospatial application.
Setup
I started off by asking where I could get solid data regarding weather. Anytime I’m in need of statistics or historical data I always start off at that fabulous data trove data.gov. There I found exactly what I was looking for – 60 years of severe weather data in a nice machine-readable format. Next I had to decide how to process and present that data and decided to just display it on a map to start with. I settled on Leaflet, a fantastic Javascript mapping library that provides a GoogleMaps-like interface using OpenStreetMap data and a powerful API. Another product, MapBox, came in handy due to its extended support for GeoJSON, a specification for communicating geographic and geometric data in JSON format which makes it ideal for storing and serving the type of data I planned to use. After writing a quick Groovy application to convert the original data from CSV to GeoJSON format I was ready to build my first map.
Data Volume
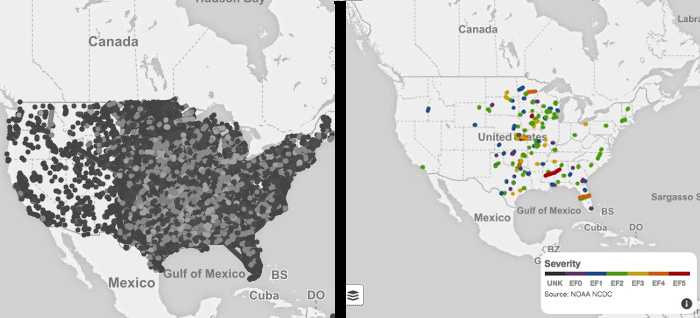
Here the first lesson I was to learn manifested itself: The United States has a lot of tornadoes. Over the past 60 years there have been tens of thousands and that immediately caused performance issues on the map. Any zoom or move operation on the map stretched into tens of seconds and I realized I would have to either simplify my data by consolidating events (which I didn’t want to do) or filter the data to only display a subset. I chose the second path and discovered that Leaflet has built-in support for this capability through Filter functions. I chose to filter by year and added a quick slider to allow the user to scroll through time in increments of one year.
Visualization
Now that the performance issue was mitigated I needed to find a way to make sense of the data. My first thought was to enhance the visual appearance of the map using standard principles of data display including color, size, and layers. GeoJSON has built-in support for specifying color and size which I chose to correlate with the severity of each storm. Due to the scale of the dataset I included these style attributes in the generated GeoJSON to reduce the processing necessary on the client to compute these static values.
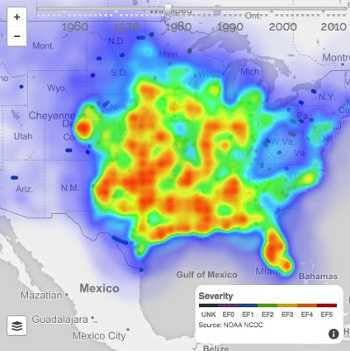
Beyond that, I chose to incorporate HeatMap layers to display the relative frequency of tornadoes over large areas. One HeatMap was added to show frequency during a single year and another to show frequency over the course of the entire dataset.
TurfJS
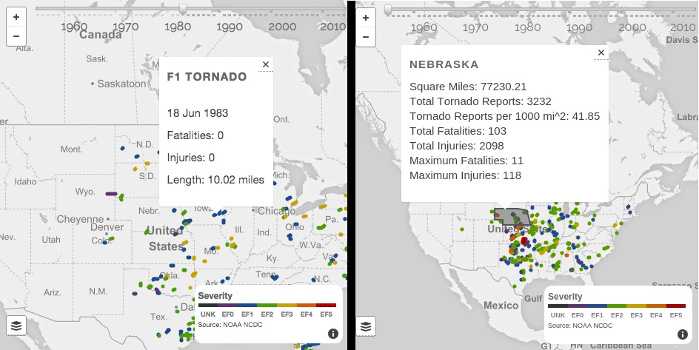
At this point, the map could display position and frequency of the storms over time but didn’t communicate much about the events en masse or provide numeric decomposition. This is where TurfJS entered the picture. Turf is capable of performing complex geographic analysis and aggregation of data in GeoJSON format allowing me to easily calculate total and average figures for tornado severity and frequency in each state. I was first able to use Turf to determine the geographic position of a user’s mouse click and compare that against a GeoJSON dataset of state borders to determine which one, if any, the user clicked inside. Once that determination was made I again used Turf to determine which of the 50,000 or so data points fell within the state’s boundaries then perform calculations based on the properties of those matching points. Once all of this calculation was completed, I could then highlight the state on the map and display a tooltip containing all the aggregate data I had collected. Beyond this, I also added tooltips to each individual storm so the user can get detailed information on any individual tornado. I used another Turf function to compute the linear distance from start to finish of the tornado’s path.
For this project I only scratched the surface of Turf’s capabilities – it has a multitude of statistical features that didn’t really fit this example including standard deviation and variance as well as providing customized geographic analysis such as auto-grouping data into grids and building Triangular Irregular Networks (TIN). This example already had ready-made groupings (states) but a lot of the more powerful features of Turf focus on calculating logical arrangements from a set of data.
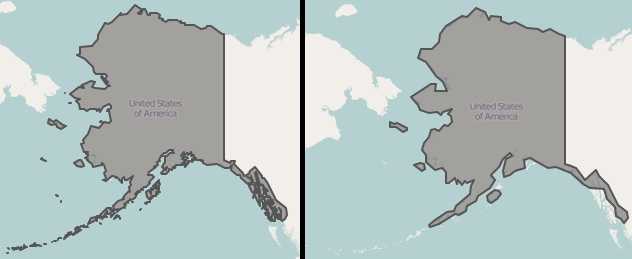
In a final pass for performance gains I went back through my earlier code and applied a few Turf-specific features. The most important one was the ability to simplify geometric shapes. The state border data I was using had relatively complex borders, especially in states with many islands like Alaska, which drastically increased the complexity of calculations Turf had to perform to determine if a point was contained within the state’s boundaries. By simplifying the state shapes I was able to maintain the general accuracy of the shape while greatly reducing the time necessary to perform those calculations.
Deployment
If you’re so inclined you can pull the code from GitHub and try it out. The included Gradle file supplies a ‘jettyRun’ task that will automatically deploy the application to an embedded Jetty instance which can then be accessed using the instructions in the README file. In addition, I have temporarily deployed the application to a Heroku instance for those who can’t run it locally. I recommend accessing the application using Chrome, Firefox, or Safari due to the heavy use of Javascript. Even with the optimizations I added using Leaflet and Turf it is still a formidable dataset and there are many complex calculations being run against it; all but the most powerful computers will likely see delays when moving between years.
Conclusions
Lesson number one: There are a lot more tornadoes than I thought there were. That said, the city of Colorado Springs was the victim of two wildfires in the few short years I lived there so on balance I think I’m safer where I am now. On the technical side of things, Leaflet paired with Turf allowed me to do some extremely powerful analysis of a very large dataset in a short amount of time. Start to finish the application took a couple days of on-the-side work with a good deal of that going towards learning the libraries and massaging data into the correct format. Furthermore, this project reminded me of just how much awesome data is available off data.gov – just browsing that site gave me several ideas for future projects. One last lesson I was reminded of is just how big a difference can be made by displaying data in a powerful way. Minor changes to the structure, combination, or display of data can have a profound impact on its usefulness and aesthetics as was the case in this project. By making use of these libraries, ready-made for exactly this sort of application, I was able to create an intuitive and communicative tool that effectively conveyed exactly the information I was originally looking for.
I hope you all enjoy taking a look at the code and trying these superb toolkits out for yourselves. As always, any questions or comments are welcome below. Happy coding!